San Francisco-Oakland Trendlines

Sunday, October 4, 2026·Charts every weekday

Published

October 4, 2026

What’s coming on sfo.metrotrendlines.com the week of October 5–9 — 10 posts on the calendar.

Monday, October 5 — Unemployment in the city of San Francisco, August 2026; SFO against normal, September 2026.

Tuesday, October 6 — San Francisco County for-sale inventory, September 2026; What San Francisco County sellers listed, September 2026.

Wednesday, October 7 — San Francisco County asking prices, September 2026; San Francisco County homes under contract, September 2026.

Thursday, October 8 — How long a San Francisco County listing sits, September 2026; San Francisco-metro unemployment, August 2026.

Friday, October 9 — California jobless claims, week of Sep 26, 2026 (pending — its numbers haven’t landed yet); San Francisco’s labor force, August 2026.

This is the plan, not a promise. Every weekday post here is tied to a data release, and a release that slips takes its post with it — the post simply waits for the day its numbers land. A figure that arrives early, a revision worth writing about, or an unexpected story out of San Francisco can just as easily add a post that isn’t on this list. Expect the week to look roughly like this, and expect at least one day of it not to.
Published

October 2, 2026

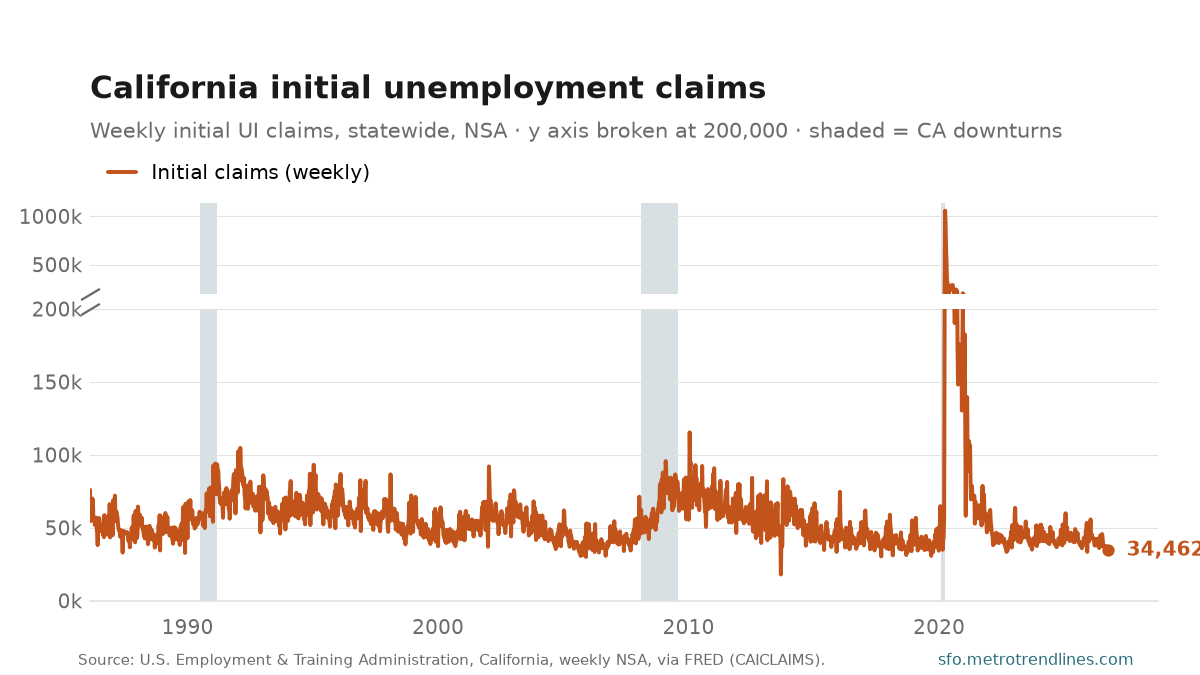
Initial unemployment-insurance claims filed in California state, weekly NSA, 1986 through the week of Sep 26, 2026, on a y axis broken at 200,000: the lower panel shows the ordinary range, a winter spike every year and a recession rise in 2008-09; the short upper panel carries the 2020 surge to 1,058,325. Latest week 34,462.

California workers filed 34,462 initial unemployment claims in the week ending Sep 26, 2026; the steadier four-week average is 34,840, down 8.5% from the same weeks a year ago.

Read the chart in two parts. The y axis is broken at 200,000. Below the break is where this series lives: almost every week since 1986 is in that band, and on its own scale the normal shape is plain — a spike every winter as construction and seasonal retail lay off, and a sustained rise through 2008-09. Above the break, on a compressed scale, is the spring of 2020, when claims reached 1,058,325 in the week of Mar 28, 2020. On a single axis that one episode flattens 40 years into a line along the floor.

Claims are the fastest labour-market number there is — a week old when published — and the noisiest. One week is a data point; the four-week average is the reading. Statewide, not seasonally adjusted, so compare with the same weeks a year earlier rather than the week before.

Source: U.S. Employment and Training Administration, initial unemployment-insurance claims for California, weekly, not seasonally adjusted, via FRED CAICLAIMS. Auto-generated each build.